In the previous blog entry Classloader leaks: the dreaded "java.lang.OutOfMemoryError: PermGen space" exception I explained how this type of problem can originate in the application code that you deploy to an application server. In this post I'll explain how to track down the leak so that you can fix it.
Profilers
Memory leak? Use a profiler. Right? Well... generally speaking the answer is yes, but classloader leaks are a bit special...
To refresh your memory (pardon the pun), a memory leak is an object that the system unintentionally hangs on to, thereby making it impossible for the garbage collector to remove this object. The way that profilers find memory leaks is to trace references to a leaked object.
What do I mean by "tracing"? A leaked object can be referenced by another object which itself is a leak. In turn, this object may also be a leak, and so on. This repeats until an object is found that references a leaked object by mistake. This reference is where the problem is, and what you need to fix. Let me try to clarify this by illustrating this with a picture from my previous blog:

In this picture the AppClassloader, LeakServlet.class, STATICNAME, CUSTOMLEVEL, LeakServlet$1.class are all leaked objects. Due to static objects (e.g. STATICNAME) in the picture, that may in turn reference other objects, the number of leaked objects may be in the thousands. Going over each leaked object manually to check if there are any incidental references to it (the red reference in the picture) until you find the troublesome object (CUSTOMLEVEL) is laborious. You would rather have a program find the violating reference for you.
A profiler doesn't tell you which leaked object is interesting to look at (CUSTOMLEVEL). Instead it gives you all leaked objects. Let's say that you would look at STATICNAME. The profiler now should find the route STATICNAME to LEAKSERVLET.class to AppClassloader to LeakServlet1$1.class, to CUSTOMLEVEL to Level.class. In this route, the red line in the picture is the reference that actually causes the leak. I said the profiler should find this route. However, all the profilers that we tried, stop tracing as soon as they reach a class object or classloader. There's a good reason for that: the number of traces grows enormous if it follows through the references through classes. And in most cases, these traces are not very useful.
So no luck with profilers! We need to try something else.
JDK 6.0 to the rescue
When Edward Chou and I worked on tracking down classloader leaks last year, we tried to run the JVM with HPROF and tried to trigger a memory dump; we looked at using Hat to interpret the dump. Hat stands for Heap Analysis Tool, and was developed to read dump files generated with HPROF. Unfortunately, the hat tool blew up reading our dump files. Because we didn't think it was difficult to parse the dump file, we wrote a utility to read the file and track the memory leak.
That was last year. This year we have JDK 6.0; this new JDK comes with a few tools that make looking at the VM's memory a lot simpler. First of all, there's a tool called jmap. This command line tool allows you to trigger a dump file without HPROF. It is as simple as typing something like:
jmap -dump:format=b,file=leak 3144
Here leak is the filename of the dump, and 3144 is the PID of the process. To find the PID, you can use jps.
Secondly, Hat is now part of the JDK. It is now called jhat. You can run it using a command line like:
jhat -J-Xmx512m leak
Here leak is the name of the dump file, and as you may have guessed, -J-Xmx512m is a parameter to specify how much memory jhat is allowed to allocate.
When you start jhat it reads the dump file and then listens on an HTTP port. You point your browser to that port (7000 by default) and through that you can browse the memory heap dump. It's a very convenient way of looking at what objects are in memory and how they are connected.
So, it seemed like a good idea to check out what can be done with these new tools to find classloader leaks.
... or not?
Unfortunately, jhat, just like the profilers we tried, also stops tracing when it encounters a class. Now what? I decided to download the JDK source code and find out what the problem is. Building the whole JDK is a difficult task from what I gather from the documentation. Fortunately, jhat is a nicely modularized program; I could just take the com.sun.tools.hat-packages out of the source tree, load them in my favorite editor and compile the code. The patched code was easily packaged and run: I just jar-ed it and added it to the lib/ext directory of the JDK:
jar -cf C:\\apps\\Java\\jdk1.6.0\\jre\\lib\\ext\\ahat.jar -C hat\\bin .
jhat leak
This was really as easy as pie. So after running the program in the debugger for some time, I figured out how it works and what changes I wanted to make. The change is that when you follow the references from a classloader, the modified jhat will follow through all traces from all the instances of the classes that it loaded. With that change, finding the cause of a classloader leak is simple.
An example
Let's look at the example from my previous blog as depicted in the picture above. Using NetBeans I created the following servlet and deployed it to Glassfish:
 1 package com.stc.test;
 2
 3 import java.io.\*;
 4 import java.net.\*;
 5 import java.util.logging.Level;
 6 import java.util.logging.Logger;
 7 import javax.servlet.\*;
 8 import javax.servlet.http.\*;
 9
10 public class Leak extends HttpServlet {
11
12     protected void processRequest(HttpServletRequest request, HttpServletResponse response)
13     throws ServletException, IOException {
14         response.setContentType("text/html;charset=UTF-8");
15         PrintWriter out = response.getWriter();
16         out.println("<html><body><pre>");
17         Level custom = new Level("LEAK", 950) {};
18         Logger.getLogger(this.getClass().getName()).log(custom, "New level created");
19         out.println("</pre></body></html>");
20         out.close();
21     }
22+    HTTPServlet methods. Click on the + sign on the left to edit the code
48 }
49
I invoked the servlet to cause the leak. Next I undeployed the servlet. Then I triggered a heap dump:
jmap -dump:format=b,file=leak 3144
and fired up the modified jhat:
jhat -J-Xmx512m leak
and brought up the browser. The opening screen shows amongst other things, all classes that are found in the dump:

Finding objects that were leaked is easy since I know that I shouldn't see any objects of the classes that I deployed. Recall that I deployed a class com.stc.test.Leak; so I searched in the browser for the com.stc.test package, and found these classes (never mind the NoLeak class: I used it for testing).
Clicking on the link class com.stc.test.Leak brings up the following screen:
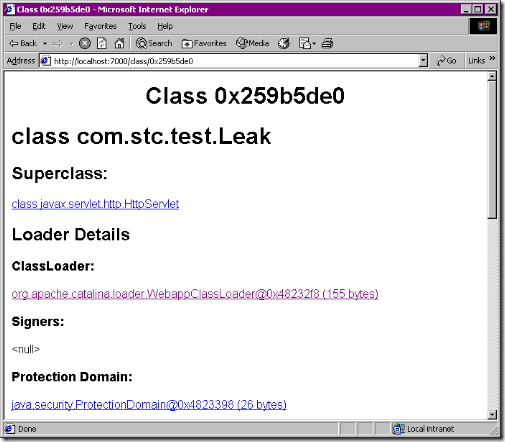
Clicking on the classloader link brings up the following screen:
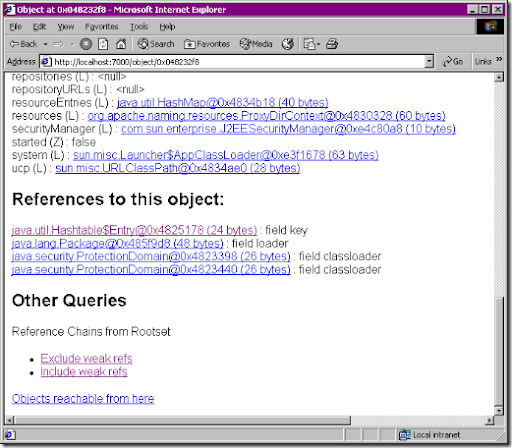
Scrolling down, I see Reference Chains from Rootset / Exclude weak refs . Clicking on this link invokes the code that I modified; the following screen comes up:

And there's the link to java.util.Logging.Level that we've been looking for!
Easy as pie!
Summarizing, the steps are:
- undeploy the application that is leaking
- trigger a memory dump
- run jhat (with modification)
- find a leaked class
- locate the classloader
- find the "Reference chains from root set"
- inspect the chains, locate the accidental reference, and fix the code
I'll contact the JDK team to see if they are willing to accept the changes I made to jhat. If you cannot wait, send me an email or leave a comment.
Update (April 2007): Java SE SDK 6.0 update 1 has the updated code.
Other Permgen space tidbits
After fixing the classloader leak, you of course want to test to see if the memory leak has disappeared. You could again trigger a memory dump and run jhat. What you also could try is to see if the amount of used permgen space memory goes up continuously after each deployment/undeployment of your application.
You can monitor permgen space usage using jconsole. You can see the memory usage go up when you repeatedly deploy and undeploy an application. However, this may not be a classloader / memory leak. As it turns out, it's difficult to predict when the garbage collector cleans up permgen space. Pressing the button in Run GC in jconsole does not do the trick. Only when you encounter a java.lang.OutOfMemoryError: PermGen space exception can you be sure that there really was no memory. This is a bit more involved than it should be!
How can we force the garbage collector to kick in? We can force a java.lang.OutOfMemoryError: PermGen space and then releasing the memory after which we force the garbage collector to kick in. I wrote the following servlet to do that:
package com.stc.test;In this servlet a custom classloader is instantiated which loads a class in that classloader. That class is really present in the web classloader, but the custom classloader is tricked by not delegating to the parent classloader; instead the classloader is instantiating the class using the bytes of the class obtained through getResourceAsStream().
import java.io.\*; import java.util.ArrayList; import javax.servlet.\*; import javax.servlet.http.\*;
public class RunGC extends HttpServlet {
private static class XClassloader extends ClassLoader { private byte[] data; private int len;
public XClassloader(byte[] data, int len) { super(RunGC.class.getClassLoader()); this.data = data; this.len = len; }
public Class findClass(String name) { return defineClass(name, data, 0, len); } }
protected void processRequest(HttpServletRequest request, HttpServletResponse response) throws ServletException, IOException { response.setContentType("text/html;charset=UTF-8"); PrintWriter out = response.getWriter(); out.println("<html><body><pre>");
try { // Load class data byte[] buf = new byte[1000000]; InputStream inp = this.getClass().getClassLoader() .getResourceAsStream("com/stc/test/BigFatClass.class"); int n = inp.read(buf); inp.close(); out.println(n + " bytes read of class data");
// Exhaust permgen ArrayList keep = new ArrayList(); int nLoadedAtError = 0; try { for (int i = 0; i < Integer.MAX_VALUE; i++) { XClassloader loader = new XClassloader(buf, n); Class c = loader.findClass("com.stc.test.BigFatClass"); keep.add(c); } } catch (Error e) { nLoadedAtError = keep.size(); }
// Release memory keep = null; out.println("Error at " + nLoadedAtError);
// Load one more; this should trigger GC XClassloader loader = new XClassloader(buf, n); Class c = loader.findClass("com.stc.test.BigFatClass"); out.println("Loaded one more"); } catch (Exception e) { e.printStackTrace(out); }
out.println("</pre></body></html>"); out.close(); }
In the servlet it tries to allocate as many of these custom classes as possible, i.e. until the memory exception occurs. Next, the memory is made eligible for garbage collection, and one more classloader is allocated thereby forcing garbage collection.
The number of custom classes that can be loaded until a memory exception occurs, is a good measure of how much permgen space memory is available. As it turns out, this metric is a much more reliable than the one that you get from jconsole.
And more
Edward Chou is thinking of some other ideas to further automate the process of determining exactly where the cause of a classloader leak is. E.g. it should be possible to identifiy the erroneous reference (the red line in the picture) automatically, since this reference is from one classloader to another. Check his blog in the coming days.
Update (April 2007): You can find an interesting usage of jhat's Object Query Language on Sundarajan's blog to compute histograms of reference chains.
126 comments:
Excellent! That has always been a sore point. Why don't you post your patch to jdk-collaboration.dev.java.net so at least all JDK contributors can take advantage of it today?
Thanks
Matthias
Excellent blog! Thanks.
When we added HAT (as jhat) to JDK 6 we knew it had some problems, but it was such a valuable tool in conjunction with jmap that we felt we needed to include it anyway. Sundar has done a fantastic job fixing some of the problems, and we definitely will accept this fix too.
-kto
Thanks for the feedback!
I submitted an RFE; see http://bugs.sun.com/bugdatabase/view_bug.do?bug_id=6484556
I'll try to upload a patch to jdk-collaboration.dev.java.net (I'm currently waiting for access to this project).
[Trackback] Frank Kieviet has written a very interesting article on how to use existing free tools to easily track down hanging references to code that has been unloaded from a JVM. Anyone writing Java code that has to deal with code loading and unloading is p...
Today I discovered your blog while googling information about JavaCAPS and transaction handling. Youre articles are very interesting and way better than the documentation delivered with JavaCAPS. Thanks for writing them!
There isn't a lot of good information on the more technical aspects of JavaCAPS in the web, so your blog is really helpfull.
Really helpfull informations, very clear, thanks for sharing. I develop with java 1.4 but with recents releases dumps are compatibles. You say it's possible to ask you for your modified libs. Could you contact me please so that I can get your libs in the next days, I have a very short dead line and I can't wait for next java release. Thanks
Hi Mickael,
Can you send me an email (frank dot kieviet at sun dot com)? I don't know your email address. The email you may have typed in the comments box is invisible to me: it's only known to the system so that it can send you an update if this thread is updated.
Frank
See also a follow up blog entry.
Great paper ! I really enjoyed figuring out these tricky points. But btw, in the 7th point of your summary, you explained "inspect the chains, locate the accidental reference, and fix the code". How the hell could we fix such a problem, as it seems that the "non freed" reference comes from outside of 'our' code ? Of course we could start changing the Level implementation, but I feel uncomfortable with that ;) ?
Thanks for any useful information
Hi Sebastien,
In the case of the problem with the <tt>Level</tt>, you could change your application code so that it does not use a new <tt>Level</tt> subclass. It's a workaround for a problem in code that you have no control over (i.e. the <tt>Level</tt> class), and as such it fixes your problem.
That's a common approach: often you cannot fix the problem properly (e.g. no control over the code, proper fix is too laborious/expensive) so you have to find a workaround.
Frank
The fix has made it into JDK 7b3.
Thanks!
> The fix has made it into JDK 7b3.
Thanks! Excellent! No more need for a patched jhat!
Frank
I'm working with JCAPS 5.1.2 and we experience this OutOfMemoryError problem, too.
Today I've downloaded JDK 7b3 and I followed your 7 steps to locate the reference. In your example, the output of jhat in step 7 is very straightforward, but in my case over 50 static references are shown which are hard to follow. Is it because we are working with EJBs? In your example you are working with Servlets.
Detlef
Hi Detlef,
Working with EJBs or Servlets shouldn't make a difference. Did you contact our support department about this? I'm interested in what references you found. Can you send me an email? (frank dot kieviet at sun dot com).
Frank
I work for a large manufacturing company. We use Business Objects XIR2. The application server for this infrastructure is running on Apache Tomcat 5.0.27 and the JVM is 1.5.0_11-b03. We are getting the dreaded OOME on one of our 2 Tomcat app servers. We have some custom apps that connect to the crashing app server. I would like to get assistance creating a monitor that will help my company determine the source of the bad code in our custom application. What assistance do you advise or are will to provide to help us resolve this issue. Please contact me, as we are desperate. I will provide more details when you contact me.
Thank you for you time.
Chris
Frank,
I am trying to debug PermGen space OOM error and to get memory dump I added -Xrunhprof:heap=all,format=b,depth=4,file=data18
on my weblogic java options and later undeployed my application and triggered dump using ctrl+break on my weblogic console (on windows XP), weblogic is terminating the dump by throwing ClassNotFoundException, I increased the depth to 70 now I got the big dump file but Jhat on java1.6 is not showing me the classloader info. I am getting following on prompt
Snapshot read, resolving...
Resolving 0 objects...
WARNING: hprof file does not include java.lang.Class!
WARNING: hprof file does not include java.lang.String!
WARNING: hprof file does not include java.lang.ClassLoader!
Chasing references, expect 0 dots
Appreciate if you could point out the missing step.
Thanks
Kumar
Re Kumar:
I don't think you need to specify heap=all; I think the stacks are not dumped if you choose heap=dump which will make the dump a lot smaller.
On which VM are you running? I have only tested the Sun VM so far. If you're running on a different one, perhaps hprof doesn't work as advertised on that VM.
You could also try to specify to dump when an OOM occurs ( -XX:+HeapDumpOnOutOfMemoryError) in which case you don't need to specify hprof on the command line.
Lastly, did you try to use jmap?
Frank
Frank,
Thanks for the response, I am using Java 5, so could not use -XX:+HeapDumpOnOutOfMemoryError or jmap directly also looks like weblogic does not support Java 6, so I ported my application on Java 6 and used tomcat to produce dump, and after running jhat, I found that two of my classes (generated classes using wsdl2java) are held by classloader that also loads Apache Axis classes, particularly XMLUtils.java, I looked at source code and found that It is using ThreadLocal and looks like reference in thread local is leaking, here I might be wrong.
I am using axis 1.4 but Apache Axis2 also has same issue where if you redeploy the any sample application on any server (tomcat or weblogic) perm gen space keep on increasing.
Are you or anyone aware of this issue with Apache Axis?
Thanks for your time.
Kumar
The "exhaust PermGen space to force GC" technique works very nicely - except if you have the hprof agent loaded, which seems to be stopping classes from unloading.
Are you available to help identify my memory leaks on my webserver?
Hi, I think this article is very interesting. I'm working with Oracle App Server 10.1.3.1.0 with Solaris SPARC 10 and this is not certified by working with JDK6 I would apreciate so much if you could send me the modified jhat version. Anyway, I'm trying to download JDK6 for solaris 10 (SPARC). Im thinking by replacing jhat included in jdk6 in my current jdk5 installation, I think the probability of failures is so high. If you can help me I'd really apreciate it. I've been working in this issue by 2 or 3 weeks and this would help me so much.
Thank's.
Thanks so much for putting this together, it helped me identify two problems with my app, and one with a third party (Axis). Unfortunately no fix for the Axis issue, but at least there's a bug for it in that project. Problem is there for Axis 1.4 and 2.
My app issues were threads that run in infinite loops, that were not interrupted when the app undeployed. Still need to find how to setup a listener to determine when the app is being undeployed and interrupt those threads.
I am interested to know how to fix the problem in Leak class. Thanks!
This is a good article. But what really is the overall solution?? Without the existance of this article or just the average java developer pursuing through the JDK source, how in the heck would anyone know about this Level class issue?
Secondly what other hidden gems like this exist out there in the JDK or the multitude of other java libraries out there? auughh!!
I read both of your postings and I am still having trouble figuring out how to find the perm gen leak and how to fix it. My web application has many classes left in memory after the undeploy. This includes many t3rd party jars. When I go into the dump using jhat, I follow your instructions. One of the last things you say is "And there's the link to java.util.Logging.Level that we've been looking for!"
What if I don't know what to look for?
The last step in your process is: "7. inspect the chains, locate the accidental reference, and fix the code"
How do I know which reference is the accidental reference?
Re Richard:
The idea is that there should be no links whatsoever from any of the undeployed classes to a root object. So, when looking at the from one of your application classes, there are still references after undeployment, these are leaks.
In the case of the Level class, I wasn't looking for the Level class, but for any remaining references. The Level class was holding a reference and hence was a leak.
To figure out which one is the accidental reference will require some work and insight into the code. For each of the links in the reference chain you would have to look at the source code and try to judge if that reference constitutes a memory leak.
Frank
I too am looking into web app memory leaks and the use of Enums.
using jmap and jhat, I am seeing my servlet class still in permgen space, after I had undeployed it. However, no rootset reference appears to point outside of my webapp class loader, unlike the mentioned example with the Logger.
maybe i am using jmap/jhat incorrectly?
Apologies for the vagueness of the post, I am trying to figure out if i really do have a leak or not.
Just to follow up,
I have a simple servlet class S, loaded on startup of the webapp. An enum E is declared in S, and used in S.init.
I am perplexed as why I see mention of java.lang.reflect.Field and org.apache.catalina.loader.ResourceEntry
in the list of 'references to this object' for the class object for E.
Is the use of enum somehow requiring some reflection? I have looked at the 1.6 source of Enum.java and don't see any static list storage issues like that of the logging example.
Stu
Great paper ! I really enjoyed figuring out these tricky points. But btw, in the 7th point of your summary, you explained "inspect the chains, locate the accidental reference, and fix the code". How the hell could we fix such a problem, as it seems that the "non freed" reference comes from outside of 'our' code ? Of course we could start changing the Level implementation, but I feel uncomfortable with that ;) ? Thanks for any useful information
Re Stu:
I haven't looked into this particular problem with Tomcat myself, but we did run into an issue where there is a bean utility in Apache that caches the accessors of Java beans. Since this cache is in the system classloader, it's a source of classloader leaks. Fortunately there's something like a flush() method on this class, so you could potentially try to call this after undeploying.
I'm not aware of anything special about enums.
Frank
Re Dual Action Cleanse:
Indeed, if you don't own the code you do have a problem. You could raise the issue with the owner of the code, try to fix it yourself, or try to find a workaround.
In case of the Level class, Sun JDK team is aware of the problem and it will hopefully be fixed in a future release; until then I'd simply recommend not using custom log levels.
Frank
Thanks for your blog. IMHO I found an issue in the JSF Reference Implementation following your instructions:
https://javaserverfaces.dev.java.net/issues/show_bug.cgi?id=742
Unfortunatly this is not the only class leak we experience, have to hunt down the other ones.
Frank,thanks for your insights. but this memory leak maybe happen not beacuse of AppClassLoader. LeakServlet1&1's classloader is not AppClassLoader(webApp classload),it is the AppClassLoader's parent. So LeakServlet1&1(class) not refer to AppClassLoader. it means AppClassLoader can be GCed. I has investigated this on Tomcat 6.0.13(java1.5) AppClassLoader is GCed
Re fangsoft:
I'm confused with what your statement that the servlet's classloader is different from the web classloader. How can that be?
Frank
frank, servlet's classloader is the same as the web classloader. but LeakServlet1&1's classloader is not web classloader but it's parent according to web specification. So LeakServlet1&1 maybe not reference web classloader.
frank, i think the application server used by your demo is implemented poorly. It can prevent AppClassLoader from referencing LeakServlet.class.
Please refer to org.apache.catalina.loader.WebappClassLoader in Tomcat6.0.14. It has a stop method to release loaded classes.It is a robust webapp's classloader implementation.
Hi there! Really nice post and quite helpful. However, we're using Axis2 and a lot of references are shown. I think there's a general problem with Axis(1 & 2) as proved by Kumar and Alex.
Hope to see improvement really soon! :)
i mentioned earlier that my Tomcat was dying with Permgen errors, and that my web app used enums.
Well, I recently ran javap on a very simple class file, generated from
enum E { E1 };
E becomes a class E, with superclass java.lang.Enum (jdk 5 or 6, i cant recall now)
Further, the static init of class E builds E1, using a private constructor. This calls super.
Now, I do not have the src to hand Enum.java, but I wonder if somehow java.lang.Enum is keeping a reference to E1, thus exhibiting the problem highlighted in this blog.
OK, so now I am hunting in the code of java.lang.Enum. I notice
that the method valueOf (which my web app DID use), references the Class object for my enum E, calling enumConstantDirectory.
In Class.java, a member variable
enumConstants is built and populated, using reflection, making a call to the static E.values (built by javac) and storing the result array, which in my case was just E1.
So now I have java.lang.Class holding on to an instance of my enum E, surely a class loader leak.
Of course this has nothing to do with Tomcat per se, any java app using Enum.valueOf would have this leak, of course only in web app reloads does it arise.
Or maybe this is all a red herring and the Enum/Class issue is solved ;)
I think the key point here is that it's not java.lang.Class (statically) that's holding on to an instance of your enum - rather it's _an instance of_ java.lang.Class. I think this means that the scenario outlined in this article doesn't apply, and there is no leak.
Hi Max, I think you are right. It was late and I didn't think it all through. I still have a hunch that my app is failing due to enum gremlins though ;)
Hold on though. the diagram above shows an instance of LeakServlet with a reference to its class. So if all objects point to their own class object, and surely they have to, else how does O.getClass() work, then my argument of a chain from some system CL to my enum does exist?
Well I tested this idea using Tomcat 6 on Sun's JDK 1.6. I have a single servlet, set to load on startup. Its init method does this
E e2 = Enum.valueOf( E.class, "E1" );
System.out.println( e2 );
I then undeploy the app using Tomcat's manager app html page.
I then use jmap to grab a heap dump and run jhat on that. I see both my servlet class and my enum listed. yet if i go through the steps above, tracing from Rootsets, I cannot see anything awry. Hence I see my classes held onto, but I (still!) cannot figure out why ;(
Kumar/Fangsoft,
I am getting into the issue you guys described here. I am using apache axis2 web archive on jboss 4.2.2.GA. JDK version is 1.5.0_14. Our server is throwing permgen errors after few days of running. Is there any fix on axis2? I am using axis2 1.3.
Appreciate your help.
Hi Frank,
I have seen your posting in the following url regarding Memory leak and rectifying memory leak using JHAT
We are facing Memory leak issue in our application,could you please send the Jhat with the changes you have done, and details of the changes done.
Thanks
Dinesh
I'm using thebuild 10.0-b23, do you if its Jhat is fixed in that version?
emerson
Hi
I just found the comment saying that your code was already included, thanks.
The problem for me is that after finding one of the classes of my packages, finding the classloader, and then excluding the weak references, I have 730 items under "Java Static References". Some of them include suns classes, tomcat classes, xpath apache, log4j and others. AM I doing something wrong here?
Also, I have a couple of threads initiated during the servlet by spring. I would think that any thread and it's objects would be destroyed and their space freed when the app is redeployed. Isn't this true?
I don't have anythingon the commons/shared lib folders.
Can you give me a light on this?
Emerson Cargnin
emerson
After reading this post I have to admit that I will never be able to get rid of this PermGen issue.
But I wonder if there is any real life scenario when it can create problems in production environment. As I see this problems happen only during redeployment and it done much less very frequently in production than during development. I most cases I can restart the server in production for redeployment.
hi,
i have Exception using java application with out using any servers, i am using netbeans ide, please find the solutions using netbeans ide.
thanks
bharath
hi
This can definitely happen without a application server, and without redeployment. There is only so much space, and once that's exhausted you get this error.
Thanks. When we added HAT (as jhat) to JDK 6 we knew it had some problems, but it was such a valuable tool in conjunction with jmap that we felt we needed to include it anyway. Sundar has done a fantastic job fixing some of the problems, and we definitely will accept this fix too.
Hi!
We are running into the PermGen OOM problem with BEA Weblogic 10.
BUT: We got this problem in production, where there is no redeployment at all!!!
Anybody knows if Weblogic does something like redeployment automatically? Maybe to get the latest application files?
We already increased PermGen size up to 384MB, but after some time (up to some weeks) after heavy load, the application runs into OOM PermGen. The server runs in production mode with nostage.
I also tried to find the class responsible for this class leak, but jhat shows a hundred of static hard references to the class loader, mostly 3rd party. But anyway, without redeploy this problem shoudn't occur?
Re Hans:
I think it's unlikely that WebLogic redeploys classes. Something you could look at:
- does the number of classes actually increase when you look with JHat?
- String.intern() also uses perm gen memory. Perhaps there's an application that does this a lot and keeps references to these interned strings so that they cannot be GC-ed?
- Are you running the latest version of the JRE with the latest patches? Ditto for the OS?
HTH, Frank
Thank you for your good information. It has helped me but I still have an issue that I have not been able to solve with my ClassLoader that is sometimes not being GarbageCollected eventually resulting in the OOM PermGen.
When looking at it with jhat it was showing 100s of static references. Each one I looked at was a Class loaded by this ClassLoader. I finally modified jhat so that when I am finding the chains to rootset for a ClassLoader to not show the static references from Classes loaded by the same ClassLoader. My list then went empty suggesting to me that it was ready to be garbage collected. (I did verify that it was properly showing static references in other cases.)
Then opening the hprof in NetBeans heap walker it showed that the GC root for the ClassLoader was Finalizer.unfinalized. I thought this also meant it could be garbage collected?
At this point I don't know where to look and am wondering if you have any further suggestions or if you notice some failed logic in my testing.
Thank you!
Your title is how to fix, but really, I only see explained how to find the issue. Maybe a blog on how to actually fix the issue would be helpful to others? Or am I missing something?
You stated...
"7. inspect the chains, locate the accidental reference, and fix the code
...
After fixing the classloader leak..."
OK, but how do you fix the leak? Seems like a section is missing? :P
Hi Frank,
Thanks for your article.
I faced with Perm Gen OOM issue with multiple applications deployed in Tomcat (7 webapps). Each webapp was deployed with its own copy of third party jars (WEB-INF/lib) all of same version - notably Spring, Hibernate, jaxb. This used to fill up Perm Gen space in no time - no redeployment scenarios here, just using the application for half a day. Upon some investigation on the HPROF dump using jhat/ahat i see lot of WebappClassLoader instances (nearly 20) holding up classes of these thirdparty jars. After some experimentation, i found that placing all these jar's in shared/lib helped me solve the problem. The memory foot print is atleast 5 times less and the rate of Perm Gen increase has also reduced substantially. I never faced Perm Gen OOM after that. I still do not completely understand how the issue got fixed by having all apps load from same Jars.
Thanks,
Chandra
Re Chandra:
There is a classloader hierarchy: the typical (and slightly simplified) situation is that there is an application classloader for each application. These application classloaders have a "common classloader" as their parent.
When a classloading request is made on the application classloader, the request is first delegated to the parent. If the parent cannot satisfy it, the application classloader will try to load it. (Parent-first delegation)
So if you move the jars to the common classloader, the common classes will no longer be loaded by the various application classloaders, but will be loaded only once by the common classloaders. As a result you save a lot of memory.
Note: with web applications you can select parent-first or self-first. If you use parent-first, you don't necessarily need to MOVE the jars to the lib directory: you could just COPY them and still save memory. If you use self-first, you will have to remove the jars from the war-files and MOVE them into the lib directory.
HTH,
Frank
Great.
This has been a problem for me forever!
I am so excited~
I had to read this post a few times before I really got all the steps, but it works like a charm
I have a web app running in Tomcat 6 with significant PermGen issues. My problem is NOT re-deploying, but OOM errors at run-time. The application itself is starting several threads through Spring. Basically, the thread classes are Spring beans.
Through heap dump analysis, I can see that the context class loader for these threads is the WebappClassLoader from Tomcat which is holding references to all of my other classes and therefore objects.
Could this be the root of my problem?
Thanks in advance - great blog!
Re Angus:
Hi,
Indeed, thread context classloaders will prevent classloaders from being garbage collected. But as soon as a new context classloader is set, the old reference is overwritten and the classloader will be able to be garbage collected. The number of threads is limited (100 or so?), so I would think that the thread context classloader would not be a typical cause of an OOM. But I guess, if memory is tight, a few classloaders hanging around longer than necessary might contribute to putting the system over the tipping point and cause an OOM.
Frank
Frank,
These threads run forever once they are created, I assume that their reference to the WebAppClassLoader keeps them from being garbage collected. Does each thread have it's own classloader instance?
We are seeing increases in PermGen utillization as various operations are performed, and the PermGen space does not go down after stopping the application.
Re Angus:
Hi,
Each web application has its own classloader. The threads are shared between applications.
Consider this scenario: application 1 is deployed and receives a burst of requests, causing all 100 threads in the threadpool to be linked to its application classloader. Next application 1 is replaced by application 2. Application 1 cannot be GC-ed because some of the threads are still linked to its classloader. Next, application 2 gets a burst of requests so that all 100 threads are now associated with the classloader of application 2. Since each thread is only linked to one classloader, this will break all the links to the classloader of application 1, and this will allow application 1 to be GC-ed.
The point of this example is to point out that the GC behavior is now dependent on how many requests are being processed. In a bad case where multiple applications are deployed, a number of these applications can linger in memory if the threads are sitting idle.
A solutions for this is to fix the servlet container so that it resets the thread context classloader. Another workaround would be to resize the threadpool so that all threads that are no longer used, are reclaimed and as such, will break their links to the classloader.
HTH,
Frank
Frank,
Thank you for that explanation, it has helped me understand one aspect that I had not understod before.
These threads which I described are not threads that process incoming http requests. They are explicitly started within the application code to handle events that need to be run in a timer-like mode. Their classloader is the WebappClassLoader. There are others created by third-party APIs for handling JMS connections. When I "stop" Tomcat, these threads are all still running.
Interestingly enough, when I "restart" Tomcat after stopping it, the Permgen no longer increases at all (looking at it with jconsole). That is very mysterious to me.
Thanks,
Angus
Hi Frank,
I am facing some problems with the permgen space error in tomcat6. There are some class file but where to add that code. Your reply will be appreciated.Thanks
It isa great thing that JDK update contained soklution to your problem. Will be testing your code on Jrockit and JDK both 165.
Will post any results on PermGen and OOM
Great post congratulations.
I'm having those problems of permGen on redeploys on Glassfish, I saw that I have instances of my EJBs even when I undeploy the application.
But unlike your webbAppClassloader my EJB classloader has several Static References and System Class References. I have lot's of $Proxy# references throughout my RootSet, is it normal?
Yes, yes, yes!
I finally found the solution to this stupid problem that has been bugging me for day! Can't thank you enough for this post
I have never overcome this problem, until now. Thank you, thank you for helping me fix a long time bug bear.
This really helpmed me a lot in fact your blog is kinda like my programming Bible now.
Is there any other cause of the PermGen space error outside of a redeploy? We restart our Weblogic server at every deploy (don't ask), but still see a PermGen space error within a couple of days of running.
Re Caeser:
>Is there any other cause of the PermGen space error outside of a redeploy?
String.intern() also uses memory in PermGen
Checked our code. There is not usage of String.intern(). There is a possibility that some JARs we are using might be calling the method, but I am not sure how we could find out. Thanks for your help; please let me know if you have any other ideas.
Lava-
I am confused by your response. First, the reporting of this error is not a problem; the problem is that the server crashes. Second, the application's Heap and CPU usage is excellent. I don't understand what does the -Xmx setting have to do with GC behavior other than defining the higher limit. No matter what your MX is set to, the GC has to try to collect when it is reaches a certain percentage of usage (among other conditions)
With regards to logging, are you talking about server logs or application logs?
Frank-
I may have found the problem. It seems the PermGen space is busted when we have an unexpected, high number of exceptions thrown (due to data inconsistencies). Correct me if I am wrong, I do believe that exceptions use the PermGen space and a very high number of them could cause it to go out of memory.
Re Ceaser:
>exceptions use the PermGen space
I have not found any evidence for this, and I don't see why this would be the case. There may be a side effect of throwing the exception that may cause the OOM error, e.g. resources (String.intern()?) are not cleaned up.
HTH,
Frank
>I have not found any evidence for this, and I don't see why this would be the case
Take a look at -
http://blogs.sun.com/jonthecollector/entry/presenting_the_permanent_generation
Frank, thanks. that's undeniable fact that as Many Exceptions Clutter, The Exceptions are not cleaned up from the Mem Space. But, What I wanted to mean by Mem Conf settings that we may force the occupied space to clean up?
Yes, The Weblogic Server logs do occupy PermGenSpace for long when it has to write too many things , As inputs overwhelm its flushing and writing ability. Please verify.
Re Ceaser/Iava:
I don't see anything on
http://blogs.sun.com/jonthecollector/entry/presenting_the_permanent_generation
that leads me to believe that exceptions occupy permgen. As far as I can see, the fastest way to trouble shoot a memory problem is to make a memory dump and then analyze why it is retaining so much memory.
HTH,
Frank
We issue the SYNCHRONIZE CACHE command to the disks after pushing all data in a transaction group, but before updating the uberblock to commit it. I'll describe the transaction group commit process in detail in a future post.
Frank, liked the idea of SYNCHRONIZE CACHE so that dirty memory buffers are committed and stale ones refreshed if not orphaned. It will help clean Heap especially PermGen Space!!
Thanks for the guide on how to fix the classloader leaks. I am a javascript noob but I still managed to fix it in my software.
Are there any other ways that the PermGen space error can appear outside of a redeploy? We restart our Weblogic server at every deploy (don't ask), but still see a PermGen space error within a couple of days of running.
Hi Frank,
I really enjoy your post about PermGen Space error. However, when I follow your post step by step I received results like:
References to org.glassfish.web.loader.WebappClassLoader@0x1000d108 (160 bytes)
Java Local References
Java Local Reference (from com.sun.enterprise.server.logging.GFFileHandler$3@0xe27fea8) :
How I know if it is a memory leak?
Thanks a lot
I have seen your posting in the following url regarding Memory leak and rectifying memory leak using JHAT
We are facing Memory leak issue in our application,could you please send the Jhat with the changes you have done, and details of the changes done.
Honest, thanks for your insights. but this memory leak maybe happen not beacuse of AppClassLoader. LeakServlet1&1's classloader is not AppClassLoader(webApp classload),it is the AppClassLoader's mother or father. Therefore LeakServlet1&1(class) not refer to AppClassLoader. this means AppClassLoader can be GCed. I has looked into this upon Tomcat six..13(java1.five) AppClassLoader is actually GCed
I keep recieving this error constantly and I have no clue how to fix it!
Resolving 0 objects...
WARNING: hprof file does not include java.lang.Class!
WARNING: hprof file does not include java.lang.String!
WARNING: hprof file does not include java.lang.ClassLoader!
Chasing references, expect 0 dots
any ideas?
You can do that by shutting down the tomcat service, then going into the Tomcat/bin directory and running tomcat6w.exe. Under the "Java" tab, add the arguments to the "Java Options" box. Click "OK" and then restart the service.
SYNCHRONIZE CACHE command to the disks after pushing all data in a transaction group, but before updating the uberblock to commit it. I'll describe the transaction group commit process in detail in a future post.
Using jmap from Java 6, I'm getting the following error:
jmap 2643
Attaching to process ID 2643, please wait...
Exception in thread "main" sun.jvm.hotspot.runtime.VMVersionMismatchException: Supported versions are 1.5.0, 1.5.0_xx. Target VM is 17.0-b16
at sun.jvm.hotspot.runtime.VM.checkVMVersion(VM.java:196)
http://bugs.sun.com/bugdatabase/view_bug.do;jsessionid=c07114f8278d5ffffffffc00245cbf418c91?bug_id=2151754 says that the fix for this was implemented within Java 7(b19). Where does this leave those of us using Java 6?!!
I am perplexed as why I see mention of java.lang.reflect.Field and org.apache.catalina.loader.ResourceEntry
in the list of 'references to this object' for the class object for E.
space error can appear outside of a redeploy? We restart our Weblogic server at every deploy (don't ask), but still see a PermGen space error within a couple of days of running.
the button in Run GC in jconsole does not do the trick. Only when you encounter a java.lang.OutOfMemoryError: PermGen space exception can you be sure that there really was no memory. This is a bit more involved than it should be!
Thanks. That’s great info for a newbie like me. I even like how you segmented your blog clearly… I’m still trying to get mine that focused. I guess it’s all a work in progress.
The coding seems very difficult to understand at first. However, I reread again and again and finally I conclude that the tutorial is much easier than what I read in the books discusses similar topics.
I've been trying to fix this bug for the longest. Thank you for sharing.
Thanks a lot for sharing Frank about ava.lang.OutOfMemoryError: PermGen space. Since we've been running into this error during our current CS assignment for class and this really helped me a lot.
Good job!
Note that if you need this in a deployment situation, consider using Java WebStart (with an "ondisk" version, not the network one - possible in Java 6u10 and later) as it allows you to specify the various arguments to the JVM in a cross platform way.
Otherwise you will need a operating system specific launcher which sets the arguments you need.
But because memory leaks in application or library code aren't the only source of the dreaded java.lang.OutOfMemoryError
I really enjoyed reading this post, big fan. Keep up the good work and
please tell me when can you publish more articles or where can I read
more on the subject? Thank you on behalf of the global marketing team. we will really appreciate you for your upcoming blast
also.
I may have found the problem. It seems the PermGen space is busted when we have an unexpected, high number of exceptions thrown (due to data inconsistencies). Correct me if I am wrong, I do believe that exceptions use the PermGen space and a very high number of them could cause it to go out of memory.
Excellent posts that explain the dreaded “java.lang.OutOfMemoryError: PermGen space” error and more importantly how to use some new Java 6 tools to diagnose the source of the problem.
I read the topic here and got me still a bit confused. I guess I would just get an update on this one to know the said discussion here.
This article gives the light in which we can observe the reality. thanks for sharing the great ideas.
Regarding the 512MB limit, look at the following comment. Due to a mistake from the user, the limit had not actually been increased from the default of 64MB.
Even though it’s possible that there’s a leak on the eclipse side, it’s also very possible that eclipse with several plugins simply needs more than 64MB of PermGen.
Also relevant is that few people have problems after increasing the max PermGen size (so there’s no continuous leakage).
In my opinion, Sun should either increase the default max PermGen size or provide a standard option to allow applications to increase it (instead of the “subject to change” option that exists now).
In addition, it would be nice if eclipse was able to configure the Sun VM to use a higher max PermGen size automatically.
I agree with Jacob on "In my opinion, Sun should either increase the default max PermGen size or provide a standard option to allow applications to increase it (instead of the “subject to change” option that exists now)."
I am perplexed as why I see mention of java.lang.reflect.Field and org.apache.catalina.loader.ResourceEntry
in the list of 'references to this object' for the class object for E.
Mike the <a href="http://www.erollover.com" rel="dofollow">401k rollover</a> guy
I am perplexed as why I see mention of java.lang.reflect.Field and org.apache.catalina.loader.ResourceEntry
in the list of 'references to this object' for the class object for E.
Great, nice site, I?m come back soon!. Really like your content.Very useful information. I am a web designer and i have seen many sites. I may have found the problem. It seems the PermGen space is busted when we have an unexpected, high number of exceptions thrown (due to data inconsistencies).
"Using jmap from Java 6, I'm getting the following error:
jmap 2643
Attaching to process ID 2643, please wait...
Exception in thread "main" sun.jvm.hotspot.runtime.VMVersionMismatchException: Supported versions are 1.5.0, 1.5.0_xx. Target VM is 17.0-b16
at sun.jvm.hotspot.runtime.VM.checkVMVersion(VM.java:196)" I agree with this comment. Thanks for the help.
i am not good at java.I remembered i have suffered with this error! before and now i got the solution
i'm still bew in java...
Hey, thanks for the guide. I often came across this very problem and had no idea how to cope with it.
Wow! Nice work. In most of taking quite some time to get to all those various steps to figure out not only what the problems were about how to get around them.
Great post Frank.
One thing I didn't get though - What is the fix for the class leak caused by the the util logging?
Alright so I've been having problems and it's making em want to pull all of my hair out!
This is what the prompt keeps telling me:
Snapshot read, resolving...
Resolving 0 objects...
WARNING: hprof file does not include java.lang.Class!
WARNING: hprof file does not include java.lang.String!
WARNING: hprof file does not include java.lang.ClassLoader!
Chasing references, expect 0 dots
What gives??
The PermGen space is set aside for the permanent generation, which includes all intern()’d String literals. These also make up the constants used in Java .class files, so if you have a program that has a lot of String constants, the PermGen can fill up quite quickly. It’s that, more than anything, that causes the issues; and these aren’t reclaimed by ClassLoaders dying.
The fact is that Sun have invested absolutely no time in making the memory processes more flexible; instead, various arbitrary ‘maximums’ are defined when the process starts, even if there might be more memory available. A decent system should have no problem in dynamically allocating more PermGen space if needed; Sun’s VM code (and all that use it) think one fixed-size-for-all works well.
In any case, to answer Ismael, it’s possible for the option to be added to eclipse.ini — but it can’t be added by default, since the presence of a non-standard option would prevent other VMs (e.g. IBM’s, Apple’s) from starting up (since they don’t understand the opton). And because Eclipse is inclusive, they can’t do that by default.
The problem is basically Sun’s hard-coded default is too small for today’s apps, and there’s talk of it being upped in future releases of the JVM — but for now, hand-editing the eclipse.ini is the way forward.
Woah! Some really complicated stuff going on here. I am just in 1st year at university, so most of this is above my head. Maybe one day, i will be at this level.
Don't feel bad Holidays...when I first started I felt the same way, but after a while you get use to.
In any case, to answer Ismael, it’s possible for the option to be added to eclipse.ini — but it can’t be added by default, since the presence of a non-standard option would prevent other VMs (e.g. IBM’s, Apple’s) from starting up (since they don’t understand the opton). And because Eclipse is inclusive, they can’t do that by default.
The problem is basically Sun’s hard-coded default is too small for today’s apps, and there’s talk of it being upped in future releases of the JVM — but for now, hand-editing the eclipse.ini is the way forward. >>>
\^\^\^
___
Confusing still.
The PermGen space is set aside for the permanent generation, which includes all intern()’d String literals. These also make up the constants used in Java .class files, so if you have a program that has a lot of String constants, the PermGen can fill up quite quickly. It’s that, more than anything, that causes the issues; and these aren’t reclaimed by ClassLoaders dying.
In any case, to answer Ismael, it’s possible for the option to be added to eclipse.ini — but it can’t be added by default, since the presence of a non-standard option would prevent other VMs (e.g. IBM’s, Apple’s) from starting up (since they don’t understand the opton). And because Eclipse is inclusive, they can’t do that by default.
It’s that, more than anything, that causes the issues; and these aren’t reclaimed by ClassLoaders dying.
The fact is that Sun have invested absolutely no time in making the memory processes more flexible; instead, various arbitrary ‘maximums’ are defined when the process starts, even if there might be more memory available.
I still hit the same error even after setting to fork="true" memoryinitialsize="1024m" memorymaximumsize="1024m"
and set ANT_OPTS... :(
byte[] buf = new byte[1000000];
InputStream inp = this.getClass().getClassLoader()
.getResourceAsStream("com/stc/test/BigFatClass.class");
int n = inp.read(buf);
inp.close();
out.println(n + " bytes read of class data");
i dont get where this is coming from
Just to draw your attention to a new tool in the space. I noticed that the Plumbr memory leak detection tool launched a version, which is now also able to detect permgen leaks.
Worked well with my simplistic test application.
This link on your webpage is not working ...
http://blogs.sun.com/fkieviet/entry/classloader_leaks_the_dreaded_java
Nice write-up.
While JHAT might be good, it isn't very efficient for large projects - I kept running out of memory both in JHAT and the browser trying to drill down to the weak links.
I've been using the Eclipse Memory Analyzer to do a similar thing.
ie:
- Open up the dump file in MAT
- Create a histogram view for all objects
- Select "Group result by->Group by classloader" in the histrogram
- Right-click on the classloader being pinned and select "Merge Shortest Paths to GC Roots->exclude weak/soft references"
You then have to drill-down instead of having a top-level list.
Post a Comment